The scientific method is a loop: observe, form a hypothesis, test, measure, reproduce and start over. Every turn brings new insight, and progress comes from running the loop again and again.
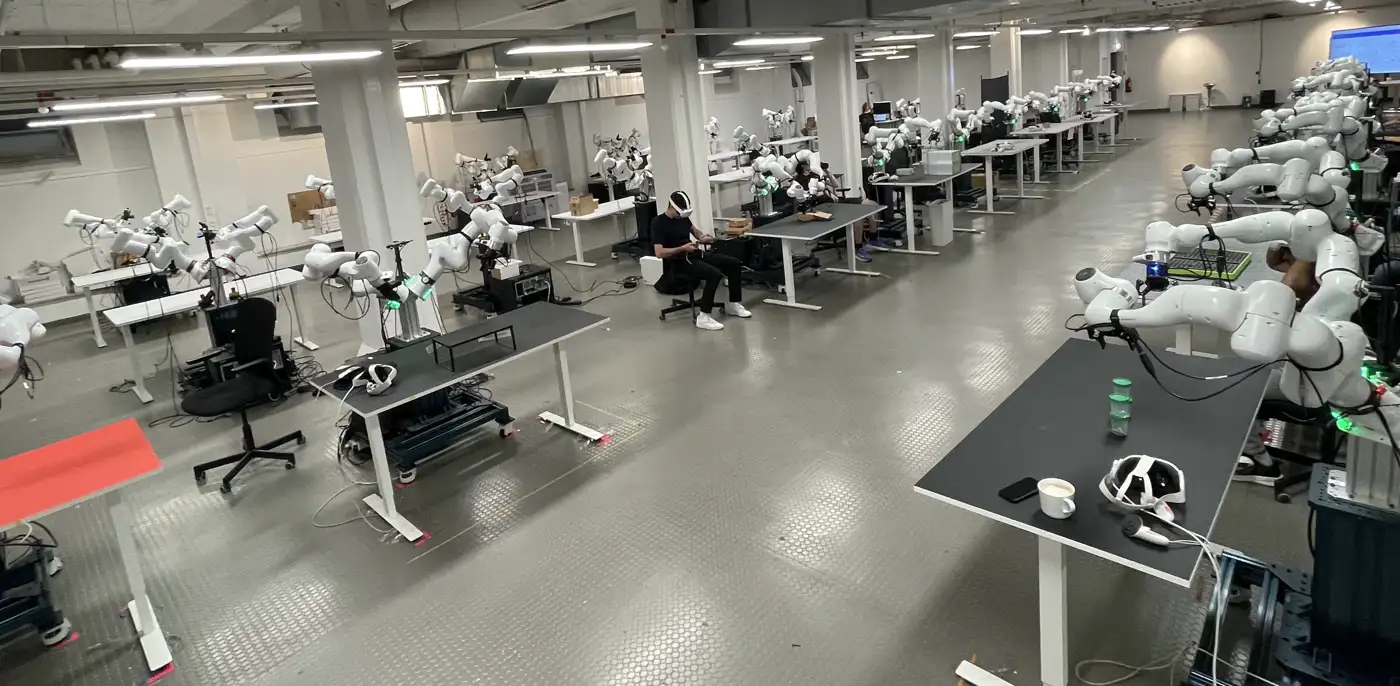
To solve physical AGI, we need to run this loop at scale. And, unavoidably, in the physical world!
Many players in the physical AI space are running this loop, each testing bold hypotheses about model architectures, training data and embodiments. Yet many results in the space fall short of statistical significance, and multi-million dollar decisions often rest on limited, largely anecdotal evidence. But anecdotes are not reliable measurements. To make better bets, we need to properly answer a simple question: how good is a robot policy, really? What’s its probability of success? That’s what every evaluation asks, and we estimate the answer from the outcomes of policy rollouts. Each rollout becomes a measurement.
An estimate is only as good as the measurements behind it. A good estimate needs 1) many measurements: the more samples, the better the estimate and the lower the noise (law of large numbers), and 2) repeatable measurements: the same measurement under the same conditions should give the same result.
At Poke & Wiggle, we care deeply about both:
We run experiments at scale
We make every one of them reproducible
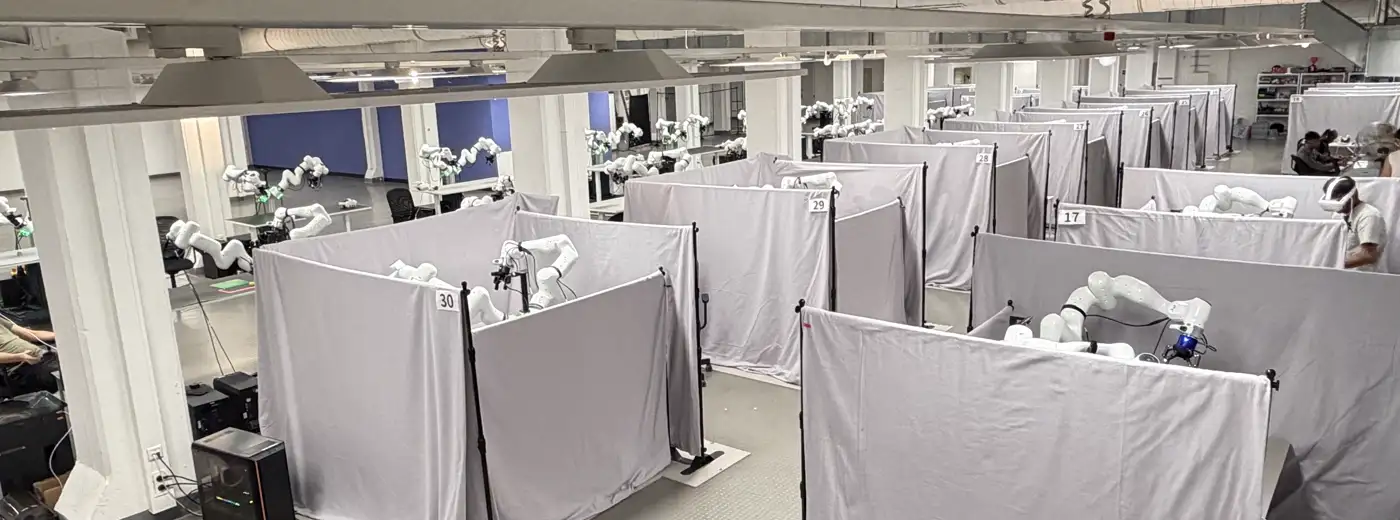
Scale. We run thousands of rollouts per day in our robot farm. Our first public benchmark, PAW-GEN-10, consists of 3,600 rollouts per policy: 14,400 in total across 4 open source models. We are releasing half of them today, and the rest will follow next week.
1 / 2
We run 30 rollouts for each experimental condition. This gives a solid first estimate of the success rate, and we will keep building on it.
Reproducibility. Scale alone is not enough. More samples only help if every measurement is clean, with nothing changing between runs except the policy. In our evals, each of the 30 rollouts starts from a different scene, and every scene is reproduced exactly for every model. See, for instance, how we compare the 4 models in a pick and place setting, with 5 different screws, each in exactly the same spot whenever a scene is reproduced:
We believe accurate measurements at scale in the real world are the rate limiter in the experiment loop towards physical AGI. The field needs a reality check, with policies tested in the real world, at scale and under reproducible conditions. The PAW-GEN-10 benchmark is our first public step in this direction.
The PAW-GEN-10 benchmark
The PAW-GEN-10 benchmark studies policy generalization along three axes:
Task-specific data regimes: How much does task-specific data affect task success?
Spatial generalization: How well does a policy handle object placements outside its training data?
Embodiment-specific data regimes: How much does pre- or mid-training on data from the same embodiment improve success rate? Coming next week.
Environments
PAW-GEN-10 consists of 10 real-world environments. Like an RL environment, each one fixes everything a policy interacts with, including the station, the scene, the objects and their placements, and the task itself, defined by an instruction and a success criterion. A rollout is one episode in an environment, and every episode can be reset and reproduced exactly.
For PAW-GEN-10, we run 10 environments covering a broad range of bimanual robotic skills:
Basic skills: sort screws into bins, push datum corner, pour screws
Tool use: open toolbox with screwdriver, clamp electrical component
High precision: connect DC jack, put tools into toolbox, route cable through closed hoops
Bimanual: place spray bottles upside, organize loaded boxes
1 / 10
e01Sort screws into binsSpecification of Sort screws into bins
Embodiment
FR3 Duo [REAL]
Scenario
PAW benchmarking station v1
Allowed controls
Full arm and gripper control at 30 Hz
Task
Sort screws into bins
Success criteria
3 black screws in the red bin
2 silver screws in the black bin
Constraints
Max episode duration: 120 s
One screw per grasp
Black → red bin
Silver → black bin
Steps
Pick up a single black screw from the table. ×3
Pick up a single silver screw from the table. ×2
Place the screw held by the gripper into its respective bin: a black screw in the red bin, a silver screw in the black bin. ×3
All 10 environments. The last 5 are held out: their footage and specification stay unpublished, but they count in every result.
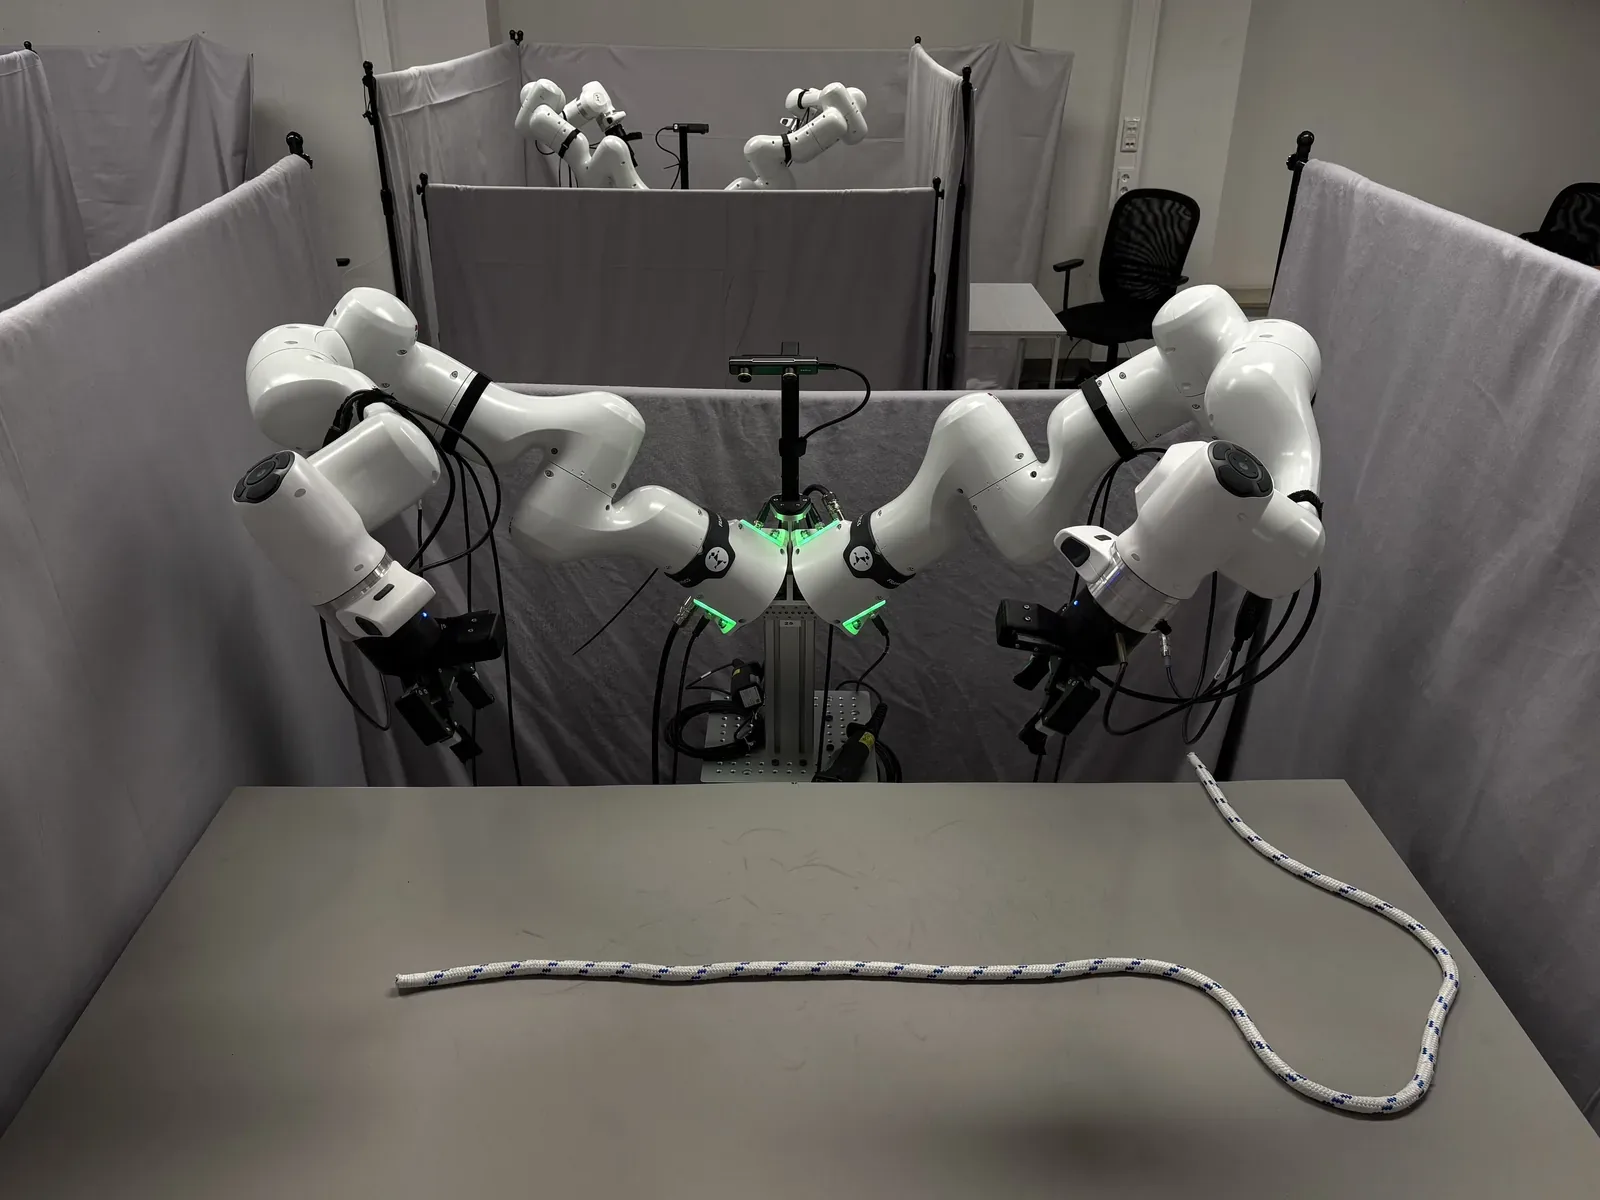
We run all experiments on our benchmarking station based on the Franka FR3 Duo platform from Franka Robotics [1]: two Franka FR3 arms on a Franka Duo pedestal, with Robotiq 2F-85 grippers, RealSense D405 wrist cameras and a ZED Mini head camera. The Duo is the logical bimanual evolution of the popular single-arm DROID platform [2], still one of the reference platforms in academia. At the same time, it is built from industrial-grade arms and grippers, which makes it the perfect middle ground between academia and industry.
Task-specific data regimes
Collecting demonstrations is the most expensive part of teaching a robot a new skill, since every episode costs operator time on a real station. So we don’t only ask how well a policy performs, but also how much data it needs to get there. We fine-tune every model three times per environment, once per data condition. That adds up to 120 fine-tuning runs across four models and ten environments. Models marked with an asterisk (*) are not the officially released checkpoints, but our fine-tunes on the target domain’s data regimes and tasks.
D10: 10 demonstrations. What can a model do from just a handful of examples?
D100: 100 demonstrations, including all of D10. Where does it stand with a realistic collection budget?
D300: ~300 demonstrations, including all of D100. Is it still improving, or has it already plateaued?
Because the sets are nested, moving up a condition only adds data and never swaps it out, so any change in performance comes from quantity alone. Together, the three conditions give a small learning curve per model and environment.
For each task, the same operator collected all training demonstrations. We consider only excellent episodes: demonstrations took roughly the same amount of time, had no failures or re-attempts at intermediate steps, and used smooth, consistent motion.
Spatial generalization
In the real world, objects never sit exactly where they did in the training data. A policy that only succeeds on the poses it was shown hasn’t learned the task, it has memorized positions. To tell the two apart, we evaluate every environment with three kinds of object placements:
Nominal: the exact poses from the demonstrations. Can the policy repeat what it was shown?
Interpolation: new poses that fall between the demonstrated ones. Can it fill in the gaps?
Extrapolation: poses outside anything in the training data. Can it go beyond what it has seen? Coming soon.
The drop from nominal to interpolation to extrapolation tells us how much of the task a policy actually understood. We use our 3D reconstruction pipeline to tightly control object placement both during data collection and during evals.
Environment shown: Pour screws into the funnel
MolmoAct 223/30: 23 of 30 nominal evaluation episodes succeeded20/30: 20 of 30 interpolation evaluation episodes succeeded
Pi 0.528/30: 28 of 30 nominal evaluation episodes succeeded27/30: 27 of 30 interpolation evaluation episodes succeeded
DiT-Flow18/30: 18 of 30 nominal evaluation episodes succeeded16/30: 16 of 30 interpolation evaluation episodes succeeded
GR00T N1.710/30: 10 of 30 nominal evaluation episodes succeeded2/30: 2 of 30 interpolation evaluation episodes succeeded
Example objectRed containerObject outlineSeen from aboveObject placementsTraining data placementsNominal evaluation placements30 scenes, all on training placementsMolmoAct 2: 23 of 30 succeededColoured by rating: ExcellentOkFailedReproducible evaluation across modelsEvery model runs the same 30 scenes.Interpolation evaluation placements30 scenes, on unseen placements between training placementsMolmoAct 2: 20 of 30 succeededColoured by rating: ExcellentOkFailedReproducible evaluation across modelsEvery model runs the same 30 scenes.
Results
Scaling task-specific training data
Data matters, with diminishing returns. Going from D10 to D100 lifts every model sharply, from 3–5% to 14–40% success. Going from D100 to D300 adds another 6–11 points, with MolmoAct 2 on top at 46%. The smaller second step is partially by design: D100 and D300 share the same or similar object positions, so the extra demonstrations add repetition more than new layouts.
MolmoAct 2*
Pi 0.5*
DiT-Flow
GR00T N1.7*
Success rate by the number of demonstrations per environment each model was trained on (D10, D100, D300). Whiskers are 95% Wilson score intervals over the evaluation episodes, which stay well defined where a success rate is 0%.
Spatial generalization: distance to training data
Moving objects to positions the policy has not seen costs 5 points of task success and 7 points of first-subtask success. Most of this gap is explained by the distance to the nearest trained pose. We report D100 and D300 only, since a D10 model has seen just 10 of the 30 nominal layouts.
Metric (D100 + D300)
Nominal
Interpolated
Change
Task success
30.7%
25.6%
−5.0 pts
First subtask success
80.5%
73.3%
−7.4 pts
Distance matters. Every 10 mm away from the nearest trained pose cuts the odds of success by about 15%. For the objects in PAW-GEN-10, rotation seems to matter less: with position held fixed, turning the grasped object barely changes its odds (0.99 per 10°). We have little data on large rotations, though, so we don’t draw strong conclusions here.
First-subtask success relative to the model's own nominal cell (1.00 = as good as nominal), D10, D100 and D300 pooled. Each cell reads grasped object / worst object; shading follows the worst object, and faded cells rest on fewer than 30 episodes.
How to read it: each cell pools episodes by how far the most displaced object sits from its nearest trained pose, in position and in yaw.
The extra failures land on the first grasp. The first grasp succeeds in 85% of nominal episodes but only 77% of interpolated ones. After the first grasp, the rest of the task goes almost as well in both cases, unless a later step is another placement-bound pick, like the second DC jack. Subtask annotations make this much easier to see. First-subtask success flags 17 of 120 model–task–size cells as significantly worse, while task success alone catches only 9.
The gap is concentrated in a few tasks and models.
Seven of ten tasks drop significantly on the first subtask. Sort screws takes the biggest hit, about 20 points on the first grasp; spray bottles, loaded boxes and the datum-corner push barely change.
Basic skills, which scatter small parts across the widest area, suffer most. Bimanual tasks hold on to the first pick and lose their points later, when placing.
The pre-trained VLAs lose only a third to two-thirds as much as DiT Flow, which we train from scratch.
The gap halves from D100 to D300.
Interpolated minus nominal first-subtask success, in points, with 95% intervals, on D100 and D300; filled points are significant at p < 0.05. 30 nominal and 30 interpolated episodes per model, task and dataset size.
Broken down by task type (D100 and D300; bold = p < 0.05):
Task type
First subtask, nominal → interpolated
Change (pts)
Task success, nominal → interpolated
Change (pts)
Basic skills
68% → 54%
−14.5
28% → 22%
−6.3
High precision
74% → 68%
−6.3
22% → 18%
−4.3
Tool use
93% → 86%
−6.3
18% → 15%
−2.9
Bimanual
97% → 98%
+0.4
60% → 54%
−6.5
Safe failures: more data, fewer collisions
When a Franka arm feels more force than it should, it stops itself with a reflex, and the episode ends on the spot. Most failures are not like that. In 86% of failed episodes both arms were fine and the policy simply didn’t finish. 95% of force reflexes happen during a pick, mostly of a small part off the table, when the policy misjudges the height and presses the gripper into the tabletop.
Pi 0.5*
MolmoAct 2*
GR00T N1.7*
DiT Flow
All policies
Episodes that failed with an arm stopped by a reflex or fault, per model and training-set size, 600 episodes each. Whiskers: 95% Wilson intervals.
More data reduces these failures. Across all policies, 14.6% of D10 episodes end with an arm stopped, against 8.9% at D300. MolmoAct 2 goes from 32.5% to 15.3% and GR00T N1.7 from 21.2% to 11.8%. Pi 0.5 and DiT Flow stay below 8% at every size, though at D10 that mostly means they rarely reach the objects at all.
Model observations
MolmoAct 2*. MolmoAct 2 [3], the largest model, is also the slowest to infer. On tasks with fast demonstrated motions it tends to fall behind, simply because it gets fewer chances to replan along the way. Still, it is the strongest policy in the benchmark: the best success rate at D100 and D300, topping out at 46%, and the smoothest motion of the four, close to the human demonstrations at about 4 m/s³ of jerk. This comes at a cost: training it takes 13 to 110 H100 hours per task, 3 to 4 times as much as Pi 0.5 and 16 to 35 times as much as GR00T N1.7 or DiT Flow. It also triggers the most force reflexes, since smooth motion aimed at the wrong height still hits the table.
Pi 0.5*. For Pi 0.5 [4], we used absolute end-effector positions as the action representation. A relative representation seems to help, though absolute positions are equally smooth and execute almost twice as fast; we’ll evaluate it in follow-up work. With very little data, Pi 0.5 performs best, reaching 5.3% success at D10, the highest of the four.
GR00T N1.7*. GR00T N1.7 [5] still jumps between chunks even with RTC, and its trajectories jitter within a single chunk too. On high-precision tasks, that jitter is often enough to fail. At D10, GR00T N1.7 gets further into its tasks than any other model and has the highest task progress, but it almost always fails right after the first grasp. The main reason is its jerky motion. At 12 to 14 m/s³, GR00T N1.7 is the jerkiest policy in the benchmark, about three times MolmoAct 2, and it ends 21% of its D10 episodes in a reflex or fault. It is, however, cheap to train, at 0.8 to 4.3 H100 hours per task.
No single model wins everywhere. MolmoAct 2 performs best but is by far the most expensive to train. Pi 0.5 leads with very little data, but not significantly ahead of DiT Flow, which we train from scratch. GR00T N1.7 gets furthest into its tasks at D10, but its jerky motion holds it back. And every model loses success as soon as objects move away from where they were demonstrated.
None of this shows up in a handful of demo videos. It takes thousands of reproducible, real-world rollouts to see where a policy really stands, and why it fails.
We are releasing half of the 14,400 rollouts today, and the rest will follow next week, together with the third axis of the benchmark: embodiment-specific data regimes.
Appendix: Training
Number of epochs
We experimented with different numbers of epochs and evaluated the results on three tasks, ranging from a simple, short-horizon task to a hard, long-horizon task.
Pi 0.5*
MolmoAct 2*
GR00T N1.7*
DiT Flow
Short taskMid taskLong task
Success rate (%) per epoch count, one panel per task, each model in its own colour. Epochs on a log scale.
Based on these experiments, we selected 3 epochs for all VLA models and 25 epochs for our DiT Flow policy, which had not been pre-trained on robotics data.
Training compute
We trained the VLA models for the same number of epochs, but their compute requirements differed substantially because of model size and which parts were frozen. Comparing models at equal compute is left for future work.
Setting
Pi 0.5*
MolmoAct 2*
GR00T N1.7*
DiT Flow
Shortest task
4.9 h
13.2 h
0.8 h
0.6 h
Longest task
27.5 h
109.9 h
4.3 h
3.1 h
Training time per model in H100-hour equivalents. One hour on an A100 80 GB
counts as 0.39 H100 hours, on an A100 40 GB as 0.32, and on an RTX PRO 6000 as
0.48.
Training parameters
Setting
Pi 0.5*
MolmoAct 2*
GR00T N1.7*
DiT Flow
Starting checkpoint
pi0.5 base
allenai/MolmoAct2
nvidia/GR00T-N1.7-3B
From scratch
Frozen part
None
None
Vision and language towers
None
Total batch size
32
64
64
256
Learning rate
5e-5
Action expert 5e-5LLM 1e-5ViT 5e-6Connector 5e-6
1e-4
2e-4
Schedule
Warmup, then constant
Warmup, then cosine to 0.1× peak
Warmup, then cosine to 0
Warmup, then cosine to 0
Action chunk
32
30
32
32
Action space
Absolute TCP pose
Delta commanded TCP pose
Relative TCP pose
Absolute TCP pose
RTC
Train time
Train time
Test time (original)
Test time (LeRobot)
Real-time chunking
For GR00T N1.7, we used the authors’ RTC implementation. For Pi 0.5 and MolmoAct 2, we implemented train-time RTC, as suggested by Physical Intelligence [6], where during training, 75% of the samples carry no prefix, so the model has to solve the hard problem of predicting a trajectory from scratch, and 25% carry a prefix matching our target delay, so it learns to continue a trajectory smoothly. We found that the no-prefix samples need the larger share, otherwise the model over-commits to the trajectory even if it is erroneous.
MolmoAct 2 training
For MolmoAct 2, we used full-rank training and removed clipping after normalization. Clipping is there to guard against noisy training data, but our task-specific datasets are already curated for high quality (see Task-specific data regimes), and our robots have reliable safety mechanisms of their own. On clean data, clipping only removes meaningful information. We noticed that clipping sometimes prevents the model from reproducing the exact trajectories of the training dataset, essentially by capping speed, since the actions are represented relative to the current pose.
References
Franka Robotics. FR3 Duo: a dual-arm platform for physical AI research.franka.de/fr3-duo
A. Khazatsky, K. Pertsch, S. Nair, et al. DROID: A Large-Scale In-The-Wild Robot Manipulation Dataset. 2024. arXiv:2403.12945
Fang et al. MolmoAct2: Action Reasoning Models for Real-world Deployment. 2026. arXiv:2605.02881
Physical Intelligence et al. π₀.₅: a Vision-Language-Action Model with Open-World Generalization. 2025. arXiv:2504.16054
NVIDIA et al. GR00T N1: An Open Foundation Model for Generalist Humanoid Robots. 2025. arXiv:2503.14734. GR00T N1.7 checkpoint: nvidia/GR00T-N1.7-3B
K. Black et al. Training-Time Action Conditioning for Efficient Real-Time Chunking. 2025. arXiv:2512.05964